Say your second quarter grew 32% and you just closed a $1.6M round. Congratulations. Now look at your chart of accounts.
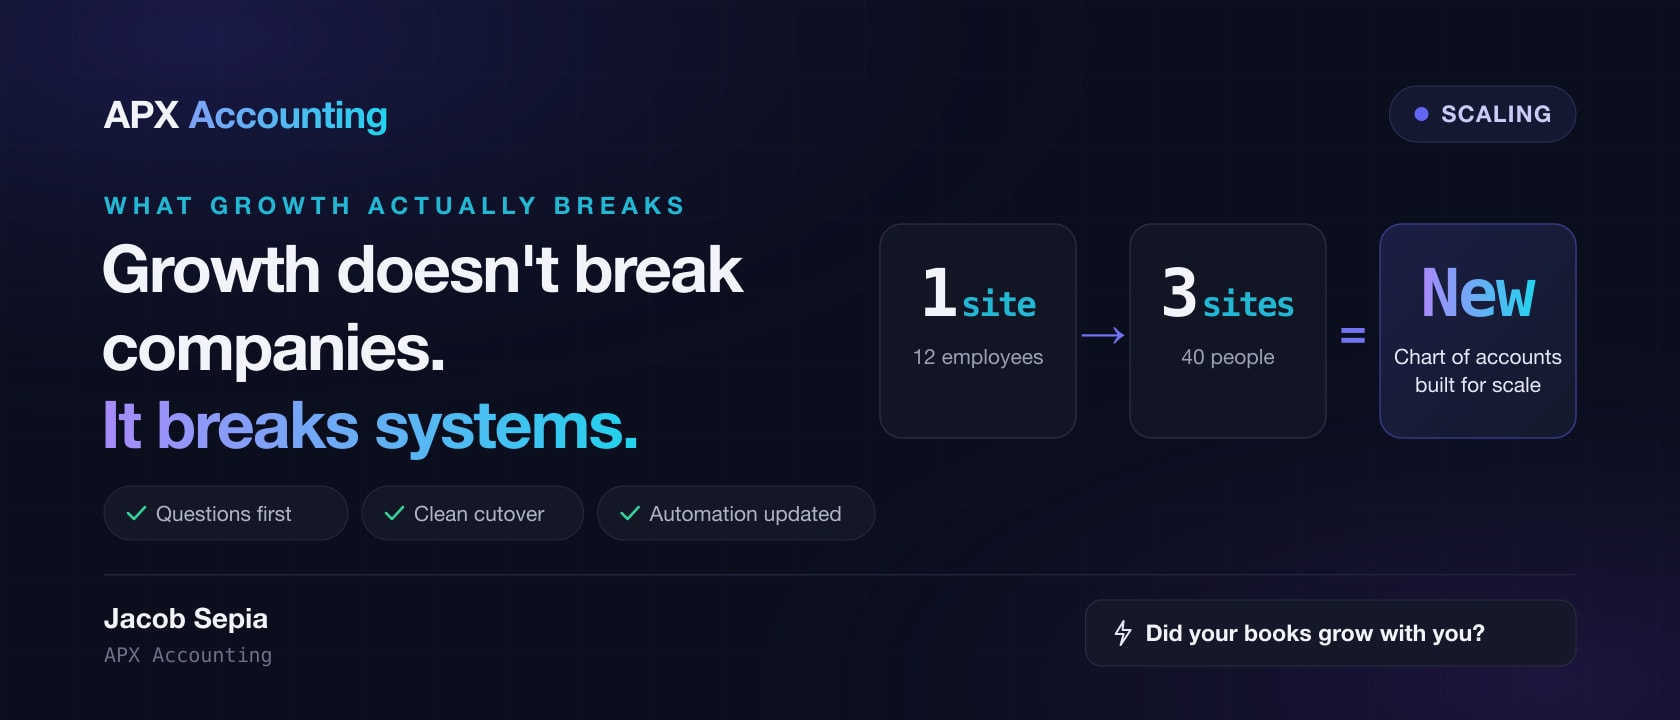
It probably looks exactly like it did when you had one location, twelve employees, and an accountant who set things up the week you incorporated. It didn't grow with you. And that's where the trouble starts.
Growth doesn't break companies. Growth breaks the systems that were built for a smaller company. The chart of accounts is usually the first one to crack, and because nobody looks at it directly, it's the last one anyone thinks to fix.
Why the Chart of Accounts Falls Behind
Most charts of accounts are built for one job: producing a tax return. That's a reasonable starting point. When you're small, the only people reading your financials are you and the CRA, and the CRA doesn't care which department spent the money.
Then the business changes. You open a second location. You hire a sales team. You start selling a second product line. You raise money, and now there's a board that wants gross margin by product, burn by department, and a forecast they can trust.
The chart of accounts responds the only way it can: someone adds an account. Then another. "Software." "Software - Marketing." "Software 2." "Misc Expense." A single "Salaries & Wages" account holding every paycheque in the company, from the warehouse to the engineering team. Five years in, you have 140 accounts, half of them used twice, and you still can't answer a basic question like "what does it cost us to serve a customer?"
The information exists. It's just not structured in a way the books can use.
Five Signs Your Books Were Built for a Smaller Company
1. Month-end takes three weeks
A slow close is almost never about effort. It's about structure. When transactions land in the wrong places, someone has to find them, move them, and explain them every single month. If your close takes longer than ten business days, the chart of accounts is very often part of the reason.
2. Nobody trusts the department numbers
If your department heads keep their own spreadsheets because "the accounting numbers are wrong," the accounting numbers are probably wrong, or at least not organized the way the business actually runs. Two versions of the truth is worse than one imperfect version.
3. The board pack gets built by hand the night before
If producing your board or investor reporting requires exporting the general ledger into Excel and re-cutting everything manually, the structure in your books doesn't match the questions you're being asked. That manual rebuild is slow, it's error-prone, and it gets harder every quarter.
4. "Miscellaneous" is one of your biggest expense lines
Catch-all accounts are where visibility goes to die. If "Other Expenses" or "General & Administrative" is among your top five lines, you're making spending decisions without being able to see the spending.
5. You added a location or an entity, and the books didn't change
A new location, a new legal entity, or a new revenue stream should change how your books are organized. If you can't pull a profit and loss for each location in a couple of clicks, the business has outgrown its structure.
What a Chart of Accounts Built for Scale Looks Like
The fix is not more accounts. It's usually fewer accounts and more dimensions.
A well-built chart of accounts answers what the money was spent on. Separate dimensions answer where and for whom. Mixing the two is what creates "Software - Marketing" and "Software - Sales" and "Software - Ops," three accounts doing a job that one account and a department tag can do better.
- A clean, numbered structure. Assets, liabilities, equity, revenue, cost of sales, and operating expenses in consistent ranges, so anyone reading the books knows where things live.
- A real line between cost of sales and operating expenses. Without it, gross margin is a guess. Anything that scales directly with what you sell (hosting for a SaaS company, materials and subcontractors for a contractor, fulfilment for an ecommerce brand) belongs above the gross margin line.
- Departments and locations as dimensions, not accounts. Xero handles this with tracking categories (you can have two active at a time, which is enough for most businesses: department and location, for example). QuickBooks Online uses classes and locations on its Plus and Advanced plans.
- Headcount costs that follow the people. Wages, benefits, and payroll taxes tagged to the team the person works on, so you can see what each part of the business really costs.
- Separate entities kept separate. Each legal entity gets its own set of books, with intercompany accounts that reconcile to each other, and a consolidation on top. Running two companies out of one file is one of the hardest messes to unwind later.
How to Rebuild Without Stopping the Business
The fear with a restructure is that it will freeze the finance function for months. Done properly, it doesn't. Here's the sequence we follow.
Step 1: Start from the questions, not the accounts
Write down the questions the business needs to answer every month. Gross margin by product? Cost per location? Burn by department? Customer acquisition cost? The new structure exists to answer those questions directly from the books, with no spreadsheet in between.
Step 2: Pick a clean cutover date
The start of a quarter or a fiscal year is ideal. Everything before the cutover stays in the old structure. Everything after goes into the new one.
Step 3: Map old to new
Every old account gets mapped to its new home. That mapping is what lets you show comparatives: last year's numbers presented in this year's structure, so trends still make sense to your board and your lender.
Step 4: Update the automation, not just the accounts
This is the step most restructures miss. Modern books run on rules: bank feed rules, receipt-capture categories, payment processor mappings, payroll journal templates. If those rules still point at the old accounts, they will quietly keep posting transactions into the old structure for months. Every rule gets reviewed and repointed at cutover. Done right, this is also where the restructure starts paying for itself, because the new rules post transactions to the right account and the right department automatically.
Step 5: Close the first month carefully
The first close under the new structure deserves extra review. After that, it should be faster than anything you've had before, because the books now match how the business works.
What You Get on the Other Side
A chart of accounts built for your current size buys you four things.
- A faster close. Less reclassification, fewer surprises, and numbers that arrive while they can still change a decision.
- One version of the truth. Department heads stop keeping shadow spreadsheets because the books finally show what they need.
- Reporting that builds itself. Board packs, lender reporting, and dashboards pulled directly from the general ledger instead of rebuilt by hand.
- Diligence readiness. When an investor, lender, or buyer asks for three years of clean history, you can hand it over without a fire drill.
The Bottom Line
The chart of accounts is the foundation everything else in your finance function sits on. Your reports, your forecasts, your dashboards, and your automations all inherit its strengths and its weaknesses.
The fix isn't a bigger finance team. It's rebuilding the foundation at the new scale: clean entities, real cost centres, rules that post transactions to the right place automatically, and a close process that runs in days instead of weeks.
If your month-end takes three weeks and your board pack gets assembled the night before, that's not a people problem. It's a structure problem, and it's fixable. Our Controller service exists for exactly this kind of rebuild, and our Tech & Automation team makes sure the rules behind your books keep up. Book a call and we'll tell you what we'd change first.